
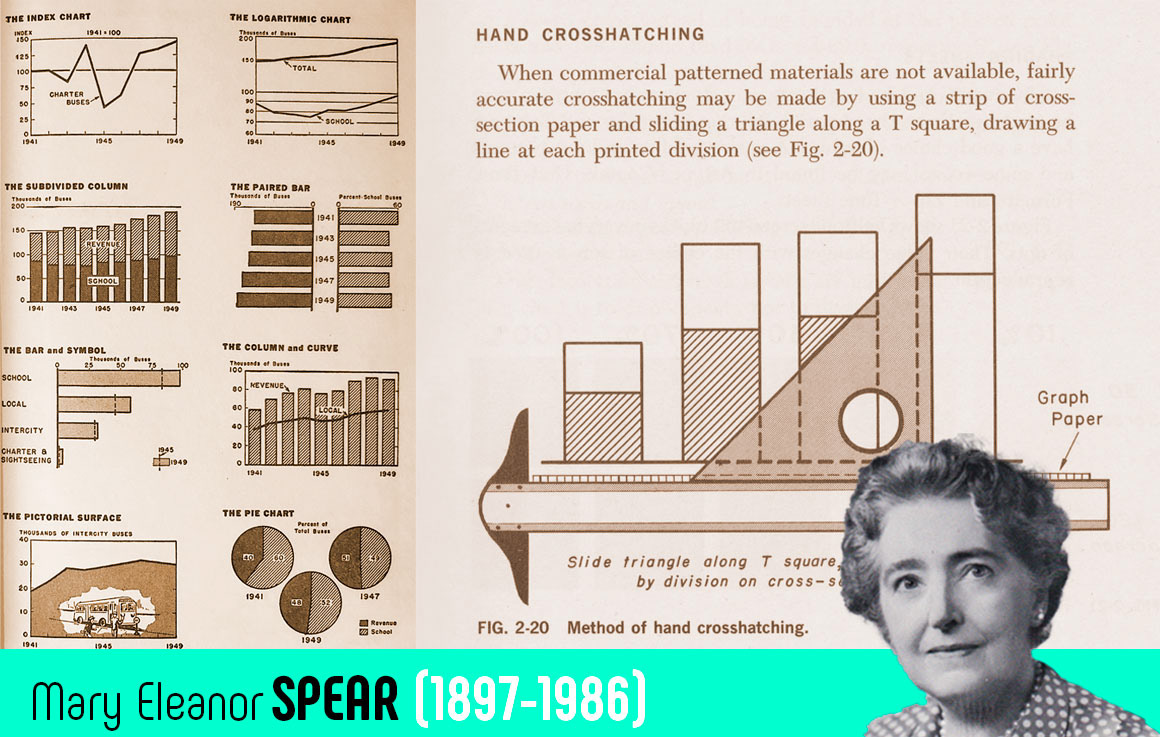
Hacemos una semblanza de 8 mujeres importantes para la historia de la infografía y la visualización de datos.
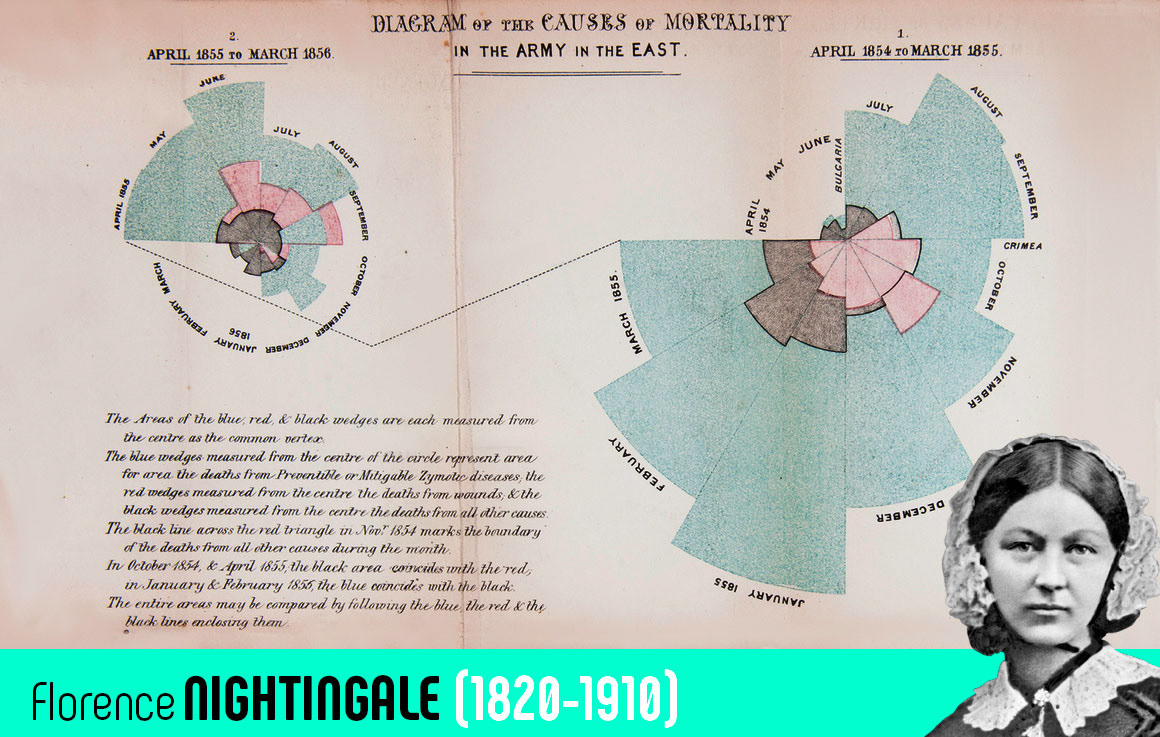
"Diagram of the Causes of Mortality in the Army in the East" (1858).
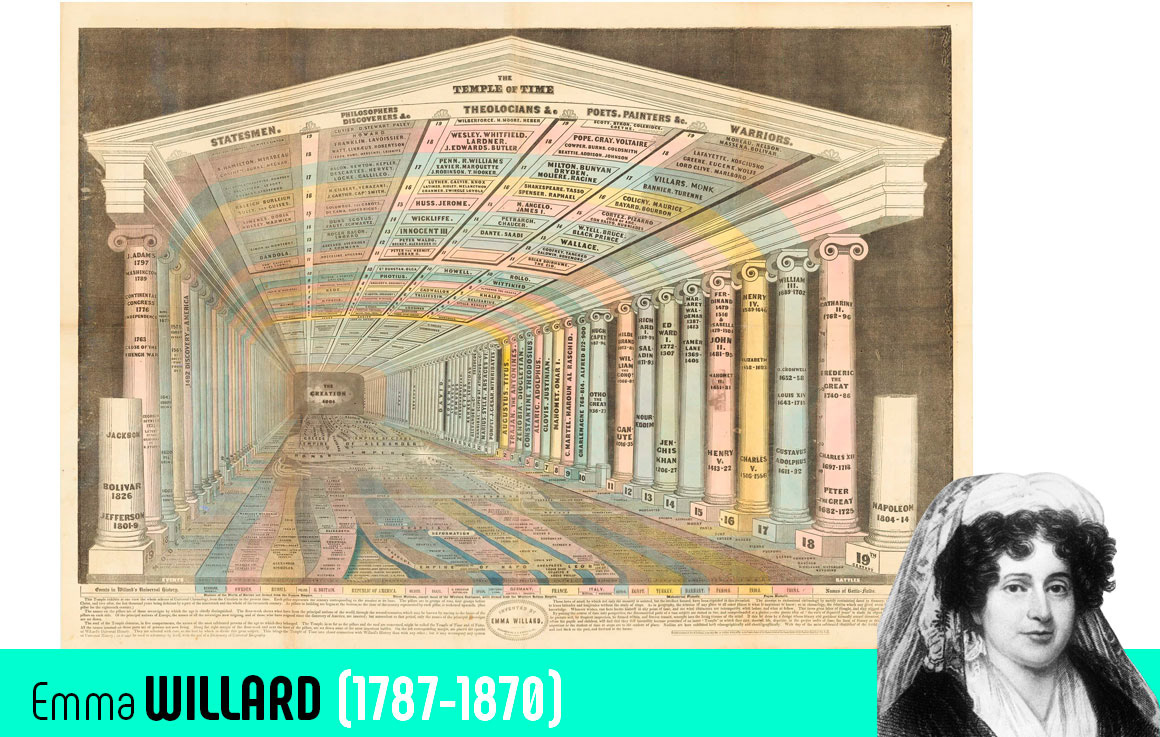
"The Temple of Time", 1846 (litografía coloreada a mano 64,7 cm por 91,4 cm)
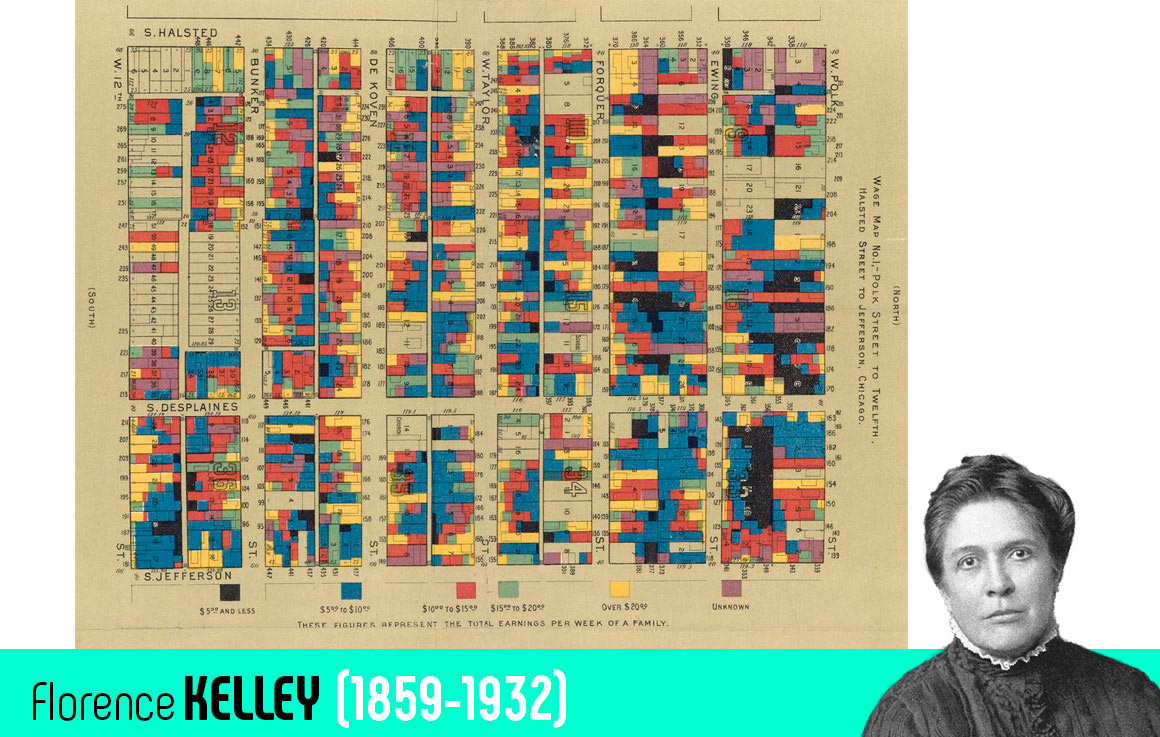
“Chicago Wage Maps”, 1895.
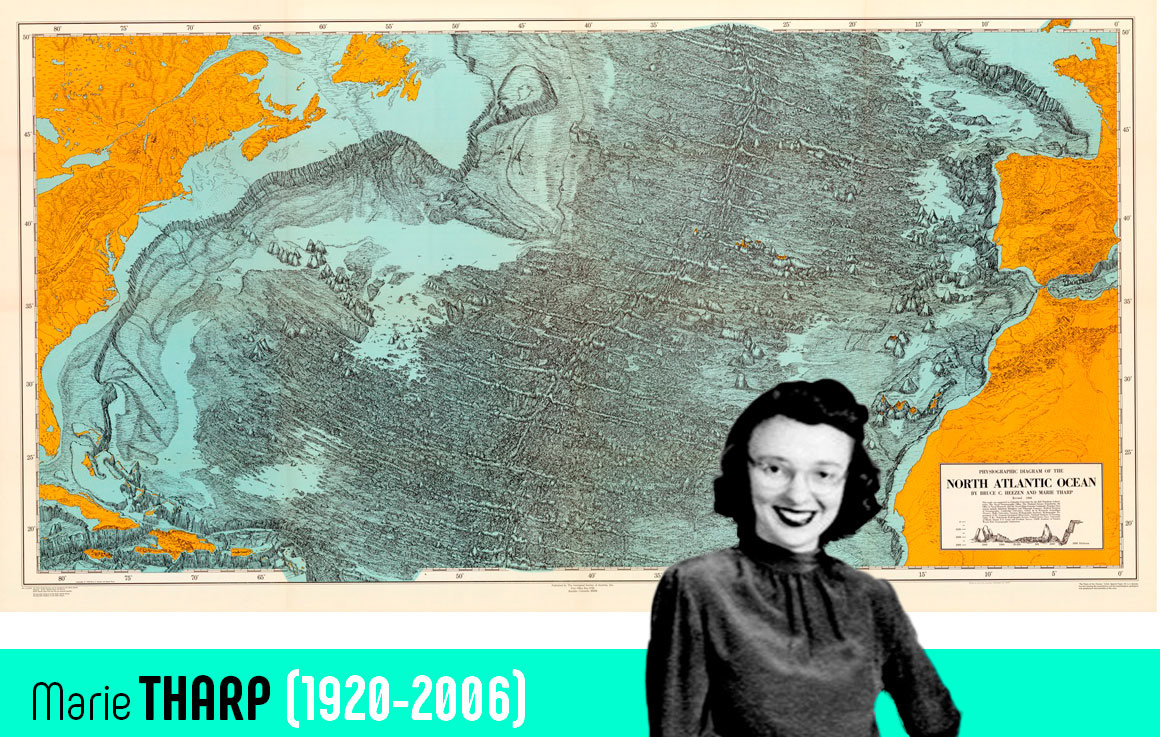
"Physiographic Diagram of the North Atlantic Ocean", 1957.

"A New Life Begins", 1961.

"Where Commuters Run Over Black Children on the Pointes-Downtown Track", (1971)
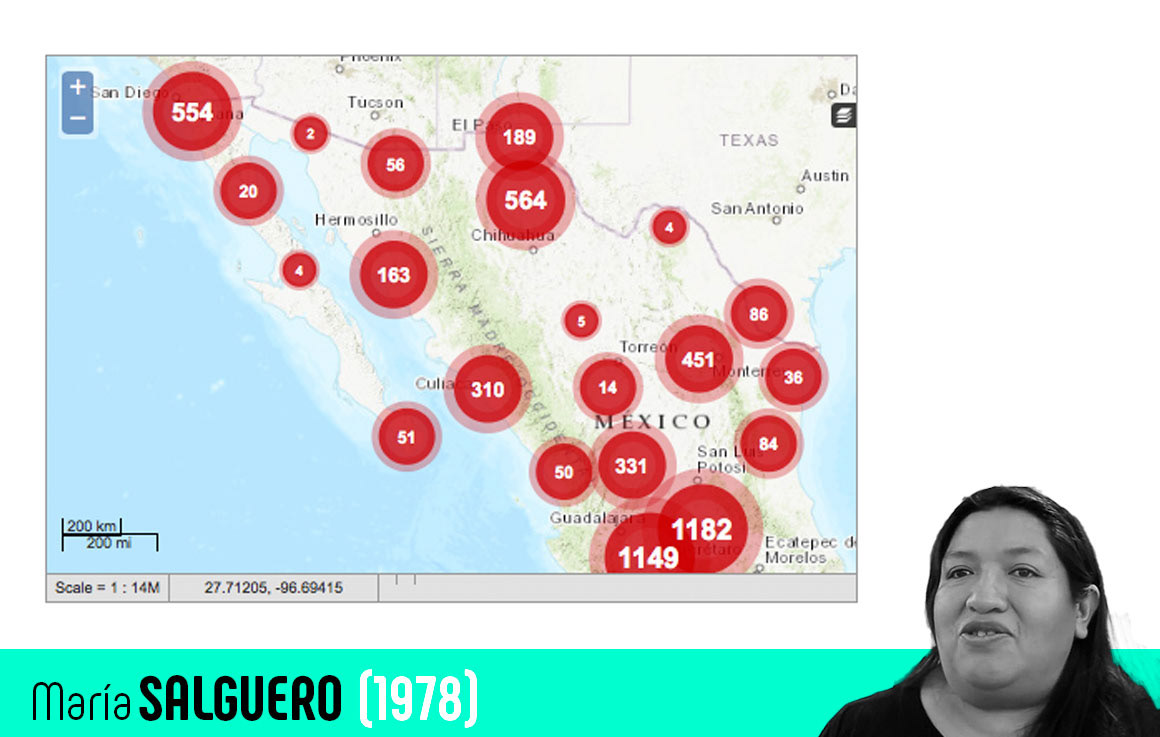
"Mapa Nacional de Feminicidios en México, (2016) https://feminicidiosmx.crowdmap.com